Be air aware with the Air Quality Index
Do you know how air quality can affect your health? You might not be able to see it, but the air you breathe could contain dangerous pollutants. The Air Quality Index can let you know what the quality of the air outside is before you open a window or step out for a walk.
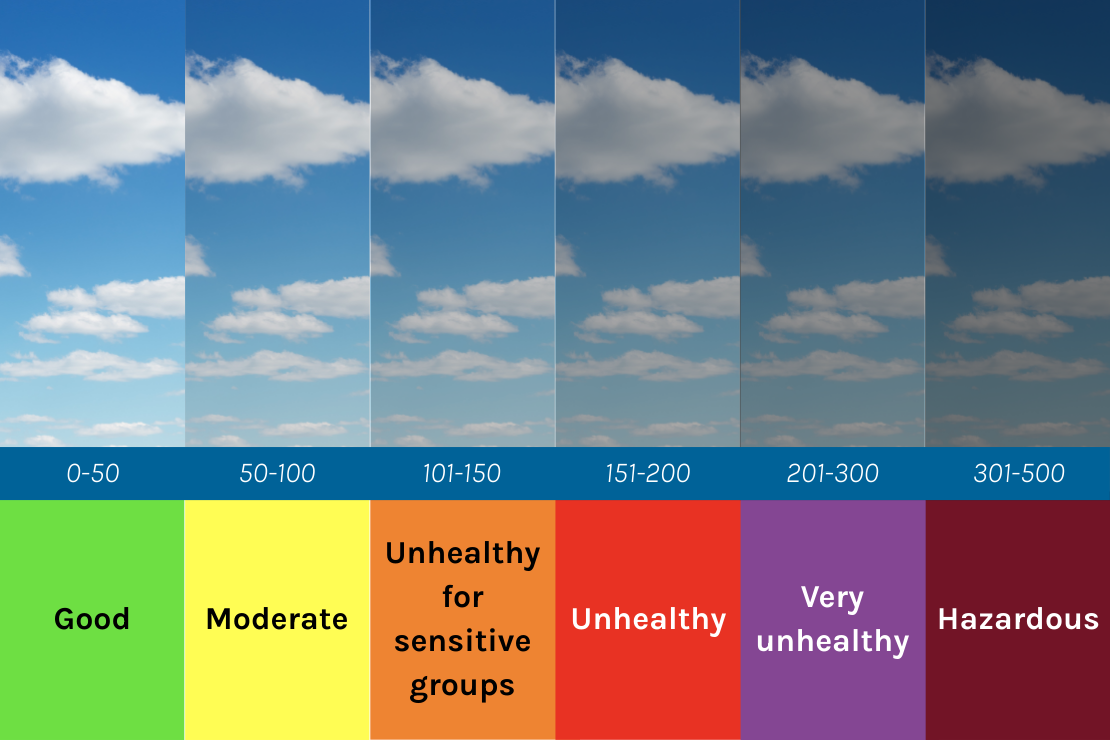
The Air Quality Index, or AQI, is the tool the U.S. Environmental Protection Agency (EPA) and state governments use to report on air quality. The AQI ranges from 0-500, with higher numbers indicating greater levels of air pollution. The values represent the concentration of five major pollutants:
- Ground-level ozone.
- Particle pollution.
- Carbon monoxide.
- Sulfur dioxide.
- Nitrogen dioxide.
Air Quality Index values and colors, explained
There are six color-coded levels of concern corresponding to ranges of index values. An AQI at or below 100 is generally considered safe for most people. Anything above 100 is unhealthy for sensitive groups initially, and then for everyone starting at 151. The Minnesota Pollution Control Agency (MPCA) produces daily air quality forecasts for levels of fine particles and of ground-level ozone using data from thirty monitoring sites across the state. When the forecast is for AQI values to be near or to exceed 100, an Air Quality Alert is issued.
Why worry about air pollution?
Being air aware can help keep you, your friends, and your family healthy. Air pollution is a mixture of gases and particles that come from industry, vehicles, wildfires, and other sources. Exposure to air pollution can make it harder to breathe, trigger asthma attacks, or cause coughing. It can also increase the risk of heart disease, stroke, and lung cancer. The types and amounts of pollution we breathe can vary based on the weather, where we live or work, and even the time of day.
Air quality can also change just like the weather, so it can be hard to tell when the air quality is good or bad. Using the AQI as a guideline for when it is best to engage in outdoor activities can help keep air pollution out of your lungs and help you avoid reactions such as chest tightness, wheezing, or shortness of breath. Air quality forecasts can help you plan whether to go to the park for lunch or stay home, and checking the current AQI value before a workout can help you decide if you should go out for that run or hit the gym instead.
How to check your air quality
Get your air quality forecast by downloading the EPA’s AirNow mobile app (available for iPhone and Android) or sign up to receive the forecast via email. Many smartphones also include air quality forecasts on their weather apps. Being air quality aware puts you in charge of your health and lets you make informed decisions about the air you breathe. To learn more about how air pollution is monitored in Minnesota, visit the MPCA website or explore the agency’s recently published air monitoring network report.
We’ll also be sharing more healthy air tips and emission reduction stories as part of Air Quality Awareness Week. Sign up for our newsletter and follow us on Instagram, Facebook, or LinkedIn to stay updated or get involved.